Since I’m heading off to college for economics not too long from now I feel I might as well get in the habit of doing some basic research and number chugging. I decided to look at recessions in recent American history in relation to Austrian Business Cycle Theory.
Now, I understand that history cannot undermine the truth of a praxeological theorem. With this said there seems to be a discrepency with Austrian theory and the severity of recessions. I did a little bit of digging and it doesn’t appear as though there’s a strict correlation between the general levels of credit expansion and the severity/duration/frequency of recessions.
In “America’s Great Depression” Rothbard credits a 7.5 increase in the money supply over a period of 7 years with causing the great depression. Now the recession of 1929/30 was originally nothing special, a fairly severe recession which was lighter than its counterpart nearly a decade earlier, however from everything I’ve been able to glean recessions in general were more severe in general, in earlier periods, and the great depression was no exception.
So my first question: Why is it that recessions were generally more severe, in early America (regardless of length) in terms of unemployent, devaluation, panic, and so on? Is this a misconception of mine?
When we look in modern times, however, there seems to be little correlation between the level of credit expansion and the severity or duration of recessions. However, shouldn’t at least the durations of recessions be increasing? Developements in the past half century have done nothing to make wages or prices in general more flexible but a lot to make both more sticky. The wages aspect should be especially true from the period of the 50’s to the 80’s when unions were more in vouge and so wages would be likely to be at least noticably less flexible than in the absence of unions. However this does not appear to be the case considering that the recessions that dotted the “prosperous” 50’s seem very insignificant and the middle 60’s are entirely devoid of recessions. According to Austrian theory it seems to me as though each one of these should have been longer or at least resulted in a greater degree of disruption than actually occured.
So why is it that recessions have not been more severe and were not more severe when unions were more common?
Now to the specific data. What I did was fairly rudimentary and simple revolving around recession dates, common knowledge, and most importantly changes in the money supply over time. I mostly aggregated based upon decade, however if need be I can of course narrow it down a little bit. There are of course 3 major measurements of the money supply, the M1 (green bills) M2 (Green bills and a variety of bank edposits) M3 (M2 and some other types of accounts). I didn’t bother with the M1 because it is included in the M2 and it always lags behind the real money supply. I also get the impression that the M3 has become more important over time, even though it was discontinued in the early 2000’s.
Which is the most important measure of money over time?
The M2
Data Specifics:
1960-1970: 97% Total increase in the money supply. Average of about 7% Growth
1970-1980: 151% Total increase in the money supply. Average of about 9.5% Growth
1980-1990: 115% Total increase in the money supply. Average of about 8% Growth
1990-2000: 47% Total increase in the money supply. Average of about 4% Growth
2000-2010: 81% Total Increase in the money supply. Average of about 6% Growth
2000-2007: 50% Total Increase. Average of about 6%
2002-2007: 30% Total Increaase. Average of about 5.5%
Data can be found by clicking “Download the data in this graph” above the upper left hand corner of the graph.
M3 Money Supply
Now the actual data for this is actually practically identical to the M2 money supply with one important exception. While only minimal differences appear in all other time periods (The numbers for 80-90 is bumped up by .5% annually and 90-2000 jumps about a percentage point annually and to 67% total increase) in the period from 1970 to 1980 there’s a 50% increase, leading to a 200% increase in money over the decade and an overall of approximately 11.5 percent annual increase. I think it’s also important to note that from the data we have from 2002 to 2006, the years before the housing bubble collapsed there was about a 6 percent annual increase in the money supply by this measure, and about a 6.5 percent annual increase from 2000 to 2006.
So by the both measures from highest rate of money growth in order from highest to lowest:
70’s
80’s
60’s
00’s
90’s
The period leading up to the popping of the housing bubble experienced between 5.5 and 6.5 percent increases in the money supply annually.
Another thing that should be important to point out is that union membership has gone down over the past decades which should lead to generally more flexibility in terms of coming out of recessions, especially as unions are pointed to by everyone as being the thing which hampers labor, a very important input, from being more fexible.
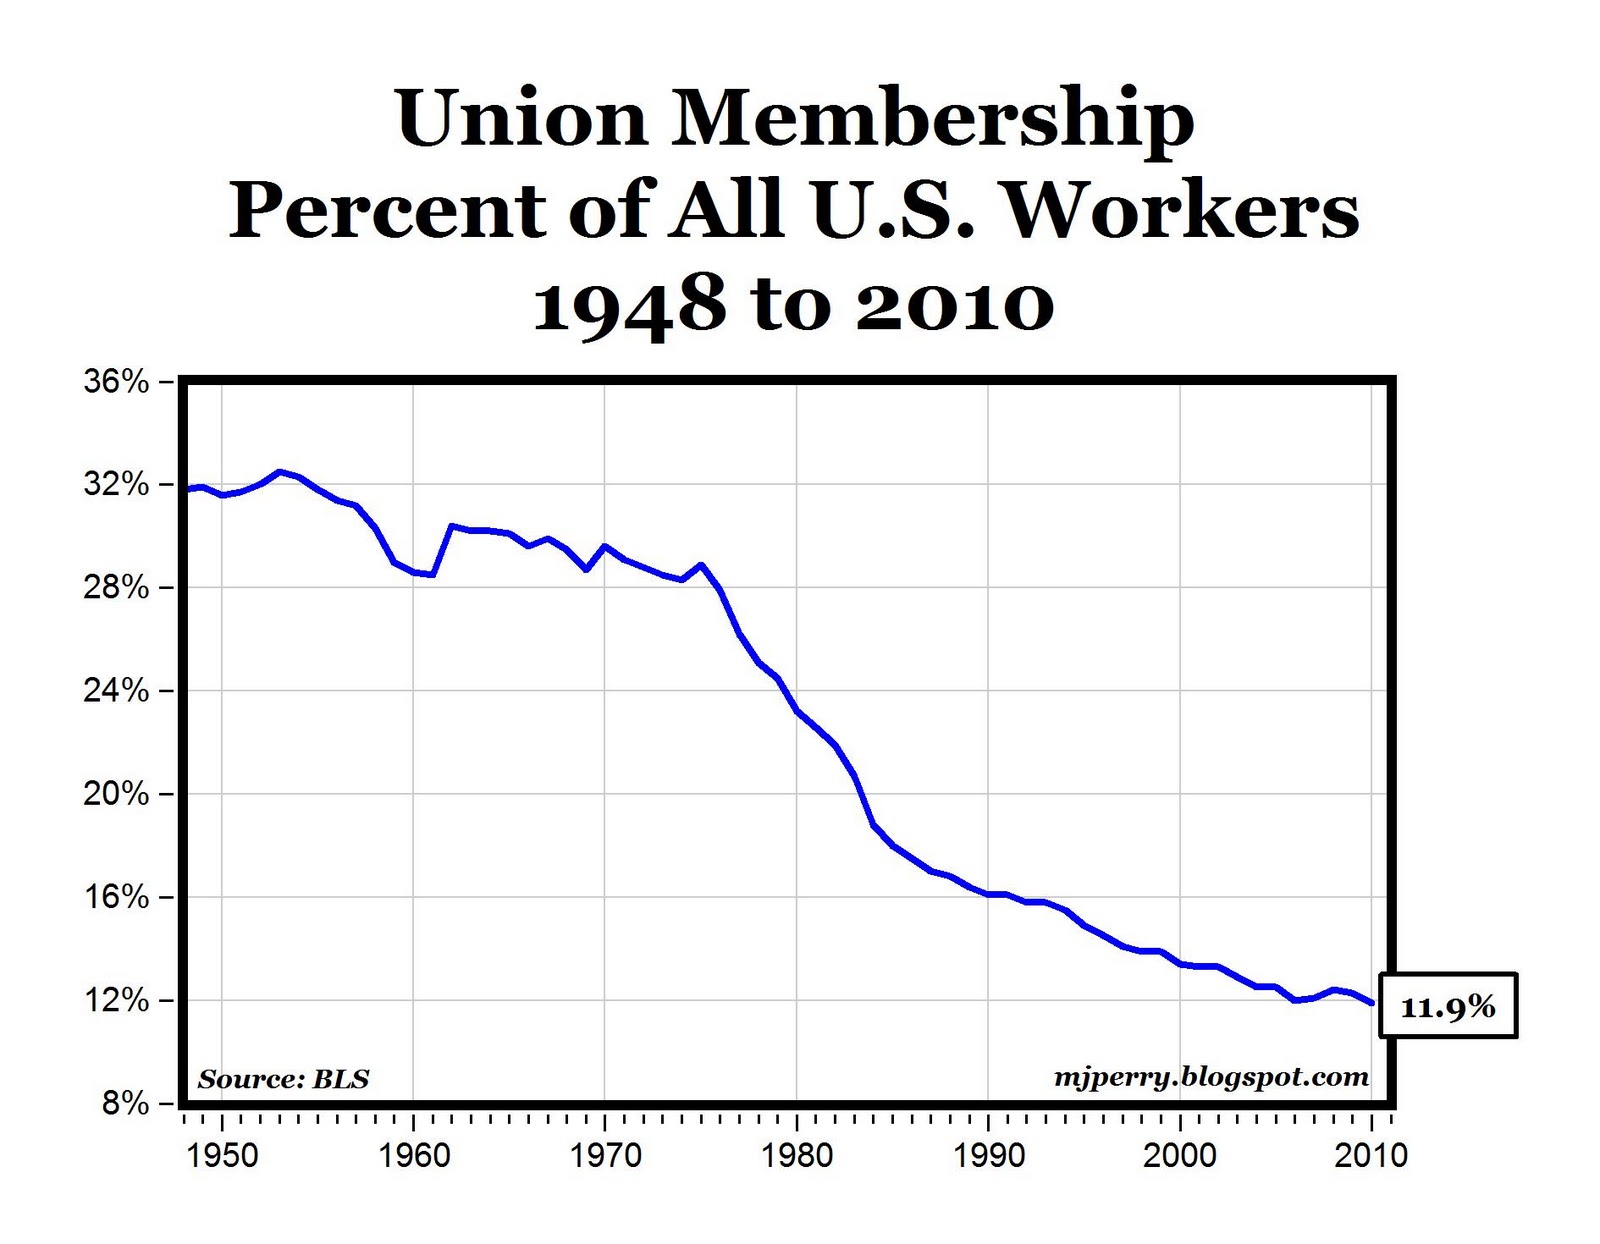
Now conclusions based upon my data:
- Beyond a certain point there does not seem to be any correlation between the amount of money increase and the date of recessions. The decade with the greatest number of recessions, both in and of itself and in its aftermath is exactly what we would expect, the 70’s had a 2 year recession in the middle of it, although an obvious rebuttle is that during this period there was the OPEC crisis going on which, of course, by any measure, would have hampered recovery, however, in the following decade there were two fairly severe recessions very early on where the effects of the 70’s credit expansion could still be felt. However, all other measures seem to fail.
The 80’s, period of second highest inflation, only saw the recessions in the first 2 years of its history which can hardly be pinned on inflation during the majority of the decade, and then a moderate recession heading into 1990.
However this would seem to indicate nothing, because then we take the period with the lowest levels of inflation, the 90’s and there’s a small recession, the size trailing the 80’s, in the early 2000’s. This occured with a miniscule 4-5% increase in the money supply as opposed to 8-8.5 percent increase.
Finally, the period with the longest recession, which of course we are still not really out of saw the second lowest in decades! With only 5.5-6.5 percent increases in the money supply we saw the longest and most severe recession since the great depression!
- The dropping of the Bretton Woods system (the last remnant of the gold standard) did NOT lastingly increase levels of inflation.
the two decades with the highest levels of inflation followed immiediatly after the system was scraped, however, the 80’s did not experience dramatically higher levels of inflation than the 60’s did. The 70’s is the obvious exception. However, both the 00’s and the 90’s saw LOWER inflation, with the 2000’s seeing minimally lower levels and the 90’s seeing significantly lower levels. So for whatever reason it doesn’t look like the fact that Bretton Woods was abandoned was the end of the world after all.
- Union membership and recession length are not directly correlated.
Now in our day it’s simply hard to decrease wages for any number of reasons, often times it’s just easier to fire people (see current recession) so in this instance the decrease in union membership may not have really increased wage flexibility all that much.
- Rampant investment in the housing market and general unwise investments caused in one way or another by government backed moral hazard was a much larger part of the current recession than traditional ABCT was
There was not a dramatic rate of inflation leading up to the crash, not enough to really account for the severity of the current crisis.
So the questions pose themselves:
- Why doesn’t there seem to be much a correlation with the height of inflation and the severity/how common recessions are?
Rothbard pointed at an annual average of 7.7 percent over 8 years as causing the great depression, which I think was indisputably more severe in terms of its first stages than anything that we have seen in decades with the exception of what we’re currently in. Now, I realize that there are no constants in the economy, there’s no reason why a single rate of interest above which there would be a severe recession and below which there would be no mass misallocation of capital goods and so on, however one would certainly expect something of a correlation, and one would not expect taht the current recession would be as bad as it is.
- Why do many Austrians point to the ending Bretton Woods as an action resulting in mass inflation OVER TIME?
There seems to be an immediate correlation lasting from 1971-1990 but from 1990-2010 inflation seems to have decreased from the pre-abandonment period. I realize that I don’t have data on the 50’s.
- Where is the huge increase in the money supply people are talking about in our day?
I hear a lot of people around here who are worried about hyper inflation, but where from? Is the money that has been distributed by the fed for the current crisis not appearing on the M2 for some reason?
- Do Austrians really have the same conception of a “recession” as the rest of the economics profession? Do you point to any other periods that could be considered recessions that can be considered examples of ABCT?
I realize that the fed is practically designed to fudge the numbers for recession dates as recessions are only defined as “two consecutive periods of negative GDP growth”, so would you point to any other recession dates? It’s also concievable to me that ABCT would not necessarily lead to a decrease in GDP. It’s even vaguely possible that every curve in the stock market we see could be examples of tiny boomlets/bustlets that are constantly occuring
Now problems that I see could be in my data
-
Recession dates by the fed are tampered with as they have a very strict definition of a recesson. Furthermore it’s impossible to know what gdp growth or general prosperity would have been in the absence of a bust, and therefore it can be impossible to pinpoint a small bust.
-
I aggregated over decades with the exception of our current recession (which I saw as the most important to look at) which could lead to gross inaccuracies. If the need arises I will look more closely at credit expansion around certain periods.
-
M3 data doesn’t extend past 06.
-
It’s hard to determine what exactly constitutes of money/money substitutes in our day with such a large and complicated banking system
-
I didn’t do any real research and the circumstances surrounding any one of these recessions
-
I really don’t consider this a problem but all information on the money supply is provided by the fed, however especially in terms of this sort of thing the fed is considered the ultimate source by most economists, and I should imagine that any large discrepencies would have been rectified by now.
Any further comments about the numbers that I pulled up, the method employed, or general observation about ABCT?
This is one of the first of the more elaborate (although still fairly simplistic) little economic research projects I’ve done so far, so any constructive advice is appreciated.
Thanks