Bryan Caplan says the following in his critique of Rothbard:
http://econfaculty.gmu.edu/bcaplan/whyaust.htm
Rothbard’s rejection of the utility function approach led him to make strange ad hoc concessions to it elsewhere in his writings. Using his value scale approach, Rothbard was able to derive the laws of demand and supply as theorems.[11] But then inexplicably in his later discussion of labor and land, Rothbard conceded the theoretical possibility of “backward” bending supply curves.[12] Furthermore, in his discussion of the economics of taxation, Rothbard admits the theoretical possibility that greater taxation of labor income could induce an increase in labor supply - even going so far as to mention a “substitution” and an “income” effect which his initial treatment of utility theory and demand utterly failed to mention.[13] What is interesting is that Rothbard was unable to derive the substitution and income effects from his value scale approach. Rather, he borrowed it from the standard utility function analysis, which shows that there are two different channels by which a price change induces a change in the quantity demanded. Thus, not only does Rothbard inappropriately dismiss the neoclassical approach to utility theory, but deemed it sufficiently fruitful that he borrowed its implications on an ad hoc basis.
To sum up, Rothbard falsely accused neoclassical utility theory of assuming cardinality. It does not. There is nothing actually wrong with Rothbard’s value scale approach, but because the neoclassical assumptions are in some ways less restrictive than Rothbard’s[14], neoclassicals made the important discovery that price changes have both income and substitution effects - a discovery Rothbard was unable to derive from his own postulates but conceded without explanation.[15] [Emphasis mine]
Here is the Rothbard quote from Man, Economy, and State about the backward bending labor supply curve:
http://mises.org/rothbard/mes/chap9a.asp
The general demand curve for a labor factor will also slope downward in the relevant area. One of the complications in the analysis of labor is the alleged occurrence of a “backward supply curve of labor.” This happens when workers react to higher wage rates by reducing their supply of labor hours, thus taking some of their higher incomes as increased leisure. This may very well occur, but it will not be relevant to the determination of the wages of a factor. [Emphasis mine]
Basically, Caplan is complaining that Rothbard did not derive the “backward supply curve of labor” from his value scale approach, but instead ripped the idea off from the neoclassicals.
From my reading of Rothbard, he did not think it was relevant to prove it can be done, as he says this is an “alleged occurrence”, but simply that others have mentioned this phenomena, which Rothbard conceded “may very well occur.”
Here is how a “backward supply curve of labor” can be derived from Rothbard’s value scale approach, at least for one person.
Let’s say a man is harvesting apples from an apple orchard. He can labor a maximum of 40 hours in one week, but he does not do that. Instead, the man allocates some of the hours to labor and some to leisure depending on his wage.
His wage is in apples harvested. He may work for himself, which anything harvested is his, or he may work for someone else, which he receives a share of what’s harvested. Either way, this does not change the outcome of the analysis.
The man has a total stock of leisure of 40 hours a week. Every leisure hour is subject to the law of diminishing marginal utility. For example, the 40th leisure hour has a lower marginal utility than the 39th leisure hour, and so on.
This is because the 40th leisure hour is allocated to a less important leisure end than that of the 39th leisure hour. Every labor hour takes away from the total stock of leisure.
To determine how many hours of leisure he will exchange for wages, the man has the following value scale:
| Supplier of Leisure Foregone Value Scale |
| (6 Apples) |
| 9th Hour |
| (5 Apples) |
| 8th Hour |
| 7th Hour |
| 6th Hour |
| 5th Hour |
| 4th Hour |
| 3rd Hour |
| 2nd Hour |
| 1st Hour |
To survive, he must maintain a minimum of 40 apples a week, which is his highest possible end. For any apples harvested beyond the amount will be allocated to lesser ends.
His value scale (mentioned above) says is willing to exchange 8 hours of leisure for 5 apples per hour, or 40 apples total.
However, he is unwilling to give up the 9th leisure hour, because that 9th leisure hour has a higher marginal utility than the 5 apples per hour. For him to give up the 9th leisure hour, the wage must be of a higher marginal utility than the 9th leisure hour. That wage would be 6 apples per hour.
Furthermore, for each successive leisure hour the man gives up, the previous leisure hour remaining in his stock of leisure would have a increasingly higher marginal utility. For him to give up one more leisure hour, he must be willing to exchange this with an increasing wage of a higher marginal utility.
Here is his complete value scale for supplying leisure foregone (providing labor):
| Supplier of Leisure Foregone Value Scale |
| (13 Apples) |
| 16th Hour |
| (12 Apples) |
| 15th Hour |
| (11 Apples) |
| 14th Hour |
| (10 Apples) |
| 13th Hour |
| (9 Apples) |
| 14th Hour |
| (8 Apples) |
| 13th Hour |
| (9 Apples) |
| 12th Hour |
| (8 Apples) |
| 11th Hour |
| (7 Apples) |
| 10th Hour |
| (6 Apples) |
| 9th Hour |
| (5 Apples) |
| 8th Hour |
| . . . |
| 1st Hour |
For each possible wage, the man accumulates a number of apples in one week, which each apple harvested increases his total stock of apples. Here is a table calculating the total stock of apples for each wage:
| Wage (Apples) |
Marginal Labor Hours |
Marginal Leisure Hours |
Total Labor Hours |
Total Leisure Hours |
Total Apples |
Maginal Increase in Apples |
| 5 |
8 |
-8 |
8 |
32 |
40 |
40 |
| 6 |
1 |
-1 |
9 |
31 |
54 |
14 |
| 7 |
1 |
-1 |
10 |
30 |
70 |
16 |
| 8 |
1 |
-1 |
11 |
29 |
88 |
18 |
| 9 |
1 |
-1 |
12 |
28 |
108 |
20 |
| 10 |
1 |
-1 |
13 |
27 |
130 |
22 |
| 11 |
1 |
-1 |
14 |
26 |
154 |
24 |
| 12 |
1 |
-1 |
15 |
25 |
180 |
26 |
| 13 |
1 |
-1 |
16 |
24 |
208 |
28 |
Notice how his total stock of apples (highlighted in yellow) is increasing every time he gives up a leisure hour (provide a labor hour). His total stock of apples is also subject to the law of diminishing utility, meaning every additional apple has a lower marginal utility than the previous apple.
He will continue to accumulate more apples, and thus give up more leisure hours, until the marginal utility of the additional apple is less than the marginal utility of the leisure hour that would be given up.
He may decide that a total stock of more than 200 apples is excessive at a wage of 13 apples per hour.
He can get rid of the excess apples by doing the reverse. He exchanges the apples for more leisure hours. This can be done because the marginal utility of the excess apples is less than the marginal utility of the leisure hours.
Here is the value scale for demanding leisure foregone (exchanging apples for leisure hours):
| Demander of Leisure Foregone Value Scale |
| (9th Hour) |
| 20 Apples |
| (10th Hour) |
| 19 Apples |
| (11th Hour) |
| 18 Apples |
| (12th Hour) |
| 17 Apples |
| (13th Hour) |
| 16 Apples |
| (14th Hour) |
| 15 Apples |
| (15th Hour) |
| 14 Apples |
Here is a table calculating the reverse exchange:
| Wage (Apples) |
Marginal Labor Hours |
Marginal Leisure Hours |
Total Labor Hours |
Total Leisure Hours |
Total Apples |
Maginal Increase in Apples |
| 14 |
-1 |
1 |
15 |
25 |
210 |
2 |
| 15 |
-1 |
1 |
14 |
26 |
210 |
0 |
| 16 |
-1 |
1 |
13 |
27 |
208 |
-2 |
| 17 |
-1 |
1 |
12 |
28 |
204 |
-4 |
| 18 |
-1 |
1 |
11 |
29 |
198 |
-6 |
| 19 |
-1 |
1 |
10 |
30 |
190 |
-8 |
| 20 |
-1 |
1 |
9 |
31 |
180 |
-10 |
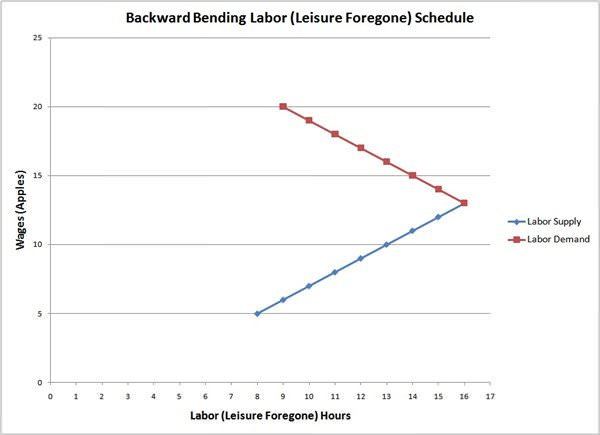
If the complete table of the wages is graphed, this is how it would look like:
Here above is the “backward bending labor supply” curve. Notice that the curve is really a juxtaposition of two schedules, an upward sloping supply schedule (in blue) and a downward sloping demand schedule (in red).
For a wage of 13 apples per hour, or less, the man is a supplier of leisure hours foregone, meaning he willing to decrease his stock of leisure hours in favor of increasing his stock of apples.
For a wage of 14 apples per hour, or more, the man is a demander of leisure hours foregone, meaning he is willing to increase his stock of leisure hours in favor of decreasing his stock of apples.
Here the mystery is resolved how a labor supply curve can be “backward bending.” It cannot, unless a demand curve is superimposed along with the supply curve, on the same graph.
There it is, income and substitution effects without indifference curves.