I went searching for violent crime graphs because some of my middle aged co-workers were talking about how good things were back in the “Good Ole Days” and how they could leave their doors unlocked and noone would break in.
Bullshit, people weren’t angels 40 years ago, violent crimes, rape, and abductions are nothing new, it’s all media hype. Here’s graphs showing violent crimes and property crimes since 1973 and things have actually been going down.
The reason I posted this here is that I wanted to see if any of you know where I could find graphs similar to this but in a longer time span, say a century?
I know rates will probably be much lower than today compared to the 40s and 50s, but my point is, is that violence is not a new trend like people seem to think today. Maybe if every child rape/abduction wasn’t shown on the news for a week, than maybe people wouldn’t think this…
how does one even measure per 1000 people ages 12 and over? People and households are very dynamic things; some are killed, some get sick, some move, unless one has a strictly motionless population then I would put some credence in these statistics but until then, I don’t see how they can avoid double counting or something.
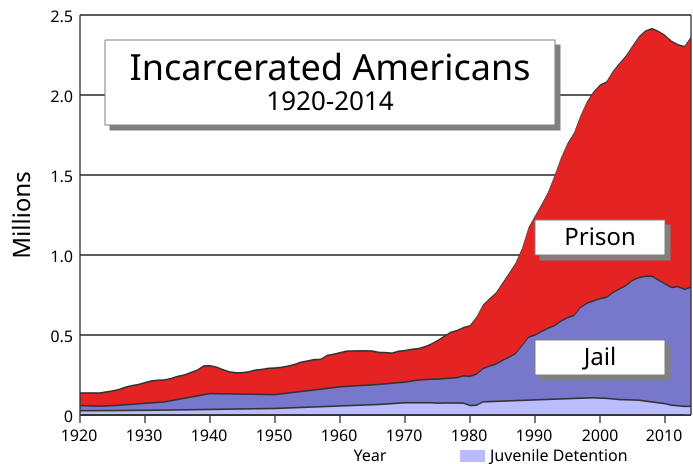
I’ve heard that the main reason we’ve had a drop in crime rate is that prison sentences are longer, so basically more and more violent (and drug using) persons are simply getting behind bars. I bet the drop in crime is perfectly counterbalanced by a raise in prison population.
Wouldn`t be surprised to learn the 1990s decline was due to the spread of the “stats juking” culture.
Sounds plausible, but it can not be the main reason. When you look at the graphs there isn`t any real corelation. The prison population starts to rise dramatically in 1980 or even 1970 but the drop in crime does not kick in until the early 1990s.
To what degree is illegal ‘violent crime’ mollified by the “legal” violent crime of taxation or other crimes which transfer wealth and power?
‘Tha heck with lockin’ doors. They mean nothing to the crook - whether he has a badge or not.
The problem with attempting to gain some ‘meaning’ from government statistics is that what defines ‘violent crime’ in those statistics is incomplete - that is, the definition is subjective and arbitrary.
How many ‘would be’ criminals of today have no need to assume the risk of breaking down doors because they get their booty in the form of a welfare check every week?
How many ‘would not be’ criminals benefit from the theft of taxation by means of government jobs?
To what degree has ‘violent crime’ increased due to the transfer of wealth and power from society to government officials?
These are the real measure of violent crime - and you can be sure government statistics do not want you to find them out.