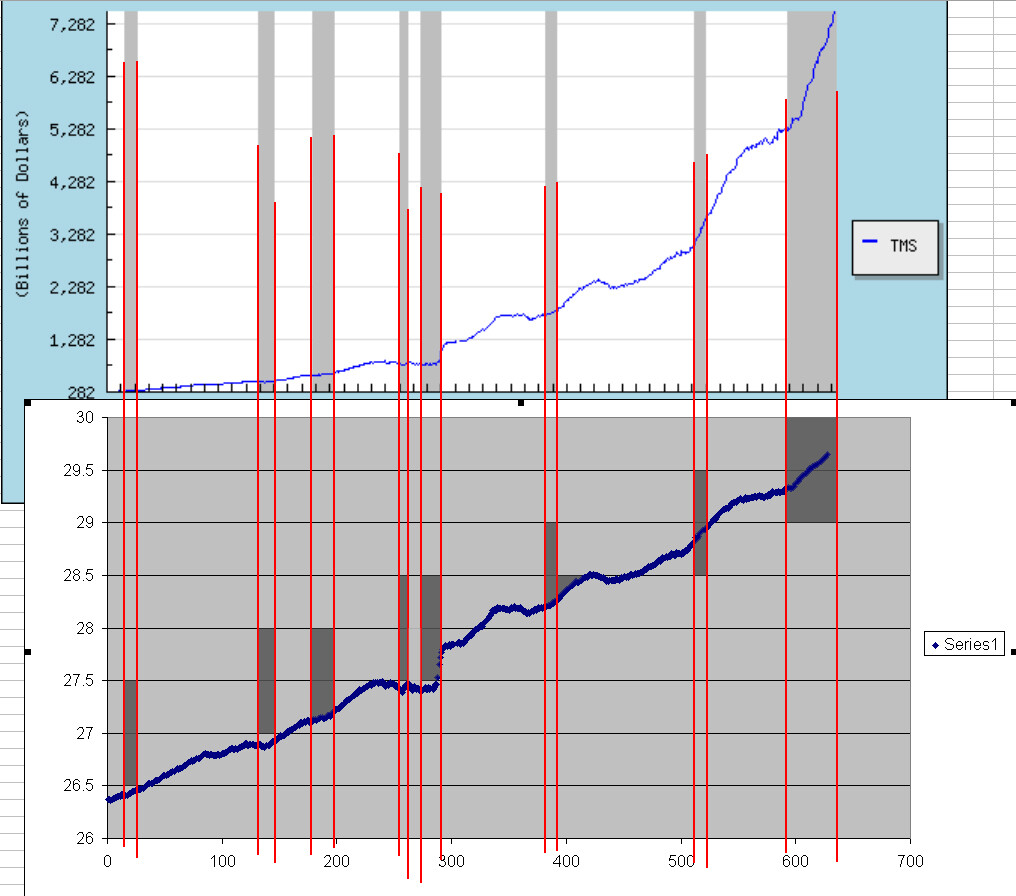
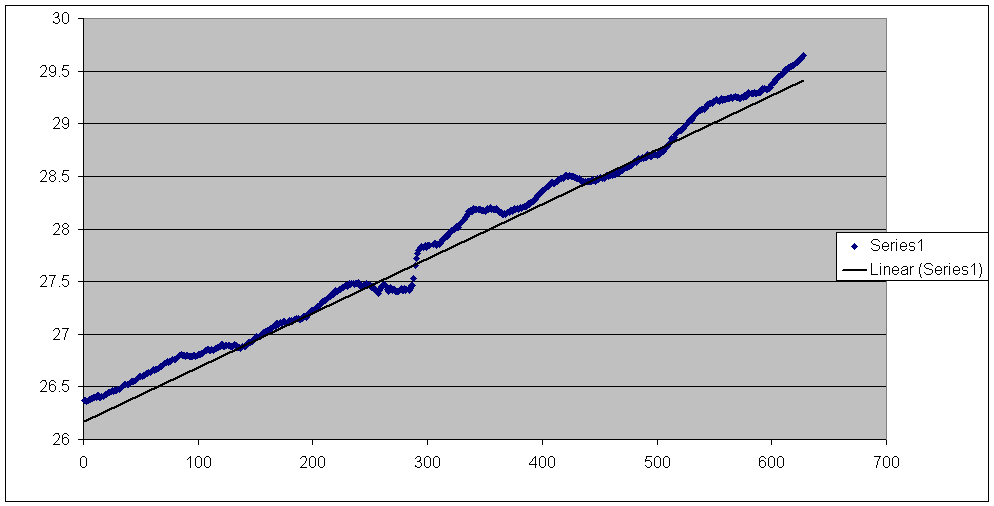
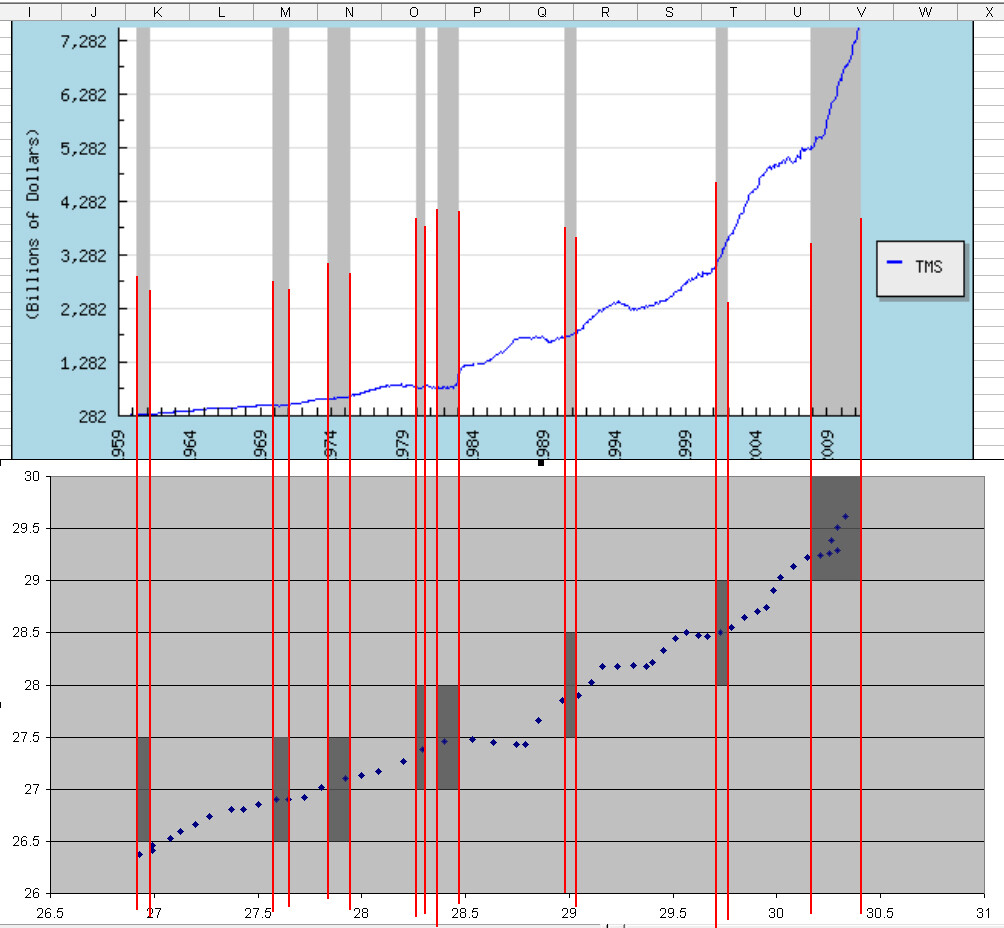
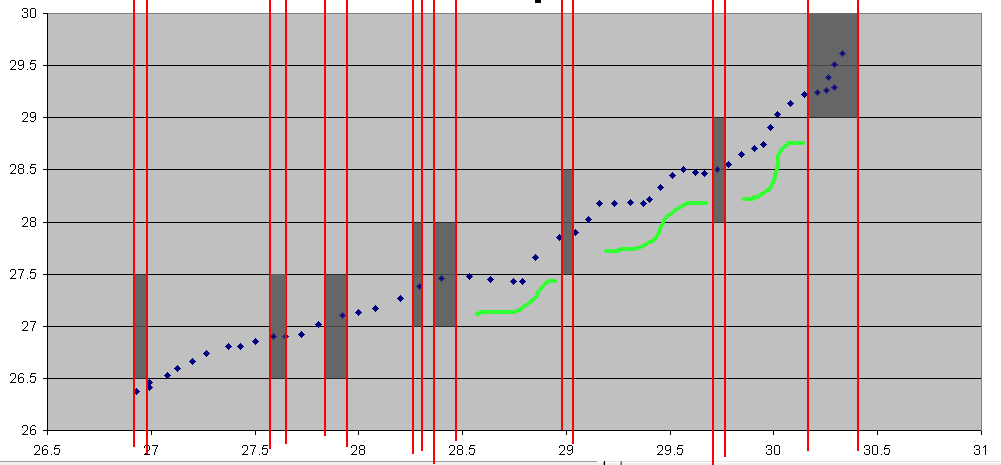
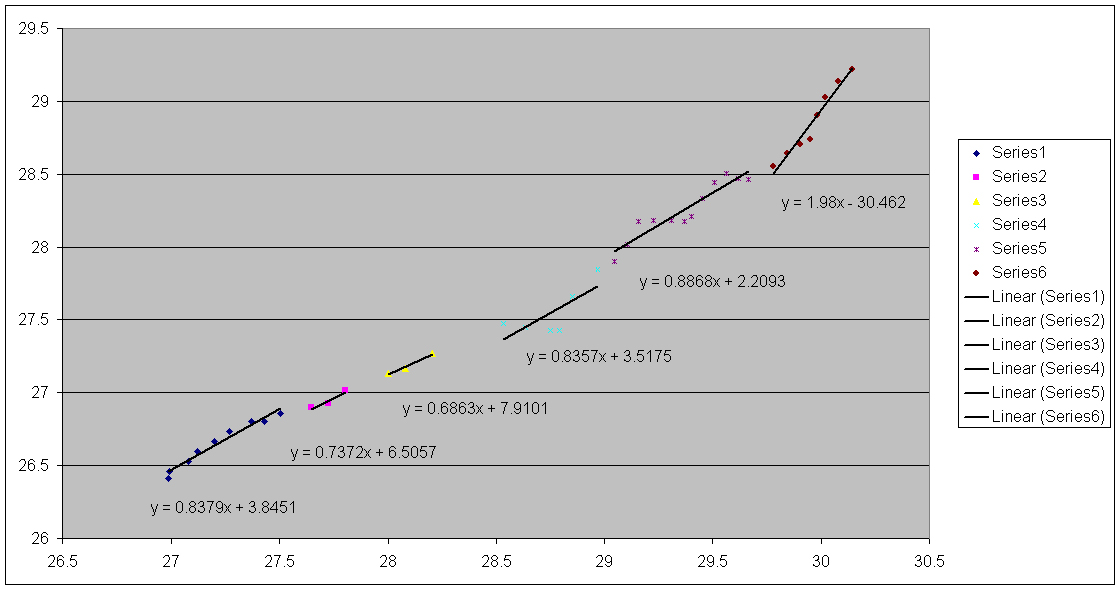
If you look at the Logarithmic chart of the TMS ( http://mises.org/content/nofed/chart.aspx?series=TMS ), it grew at about double the rate from 1959-1979 as it did onwards from there. Yet despite the ABCT predicting milder business cycles due to less intertemporal discoordination as a result of slower increase of money supply, the opposite is what has happened since the Reagan era, the business cycles are more dramatic than ever, despite a much slower rate of growth of money.
This appears to empirically refute the central premise of the ABCT.
ABCT is not an quantitative theory, so, no, quantitative observations cannot “refute” it.
Also note that Austrian theory acknowledges the existence of a natural business cycle. There will be booms and busts even in an economy in which the government is not interfering. The difference is that natural booms/busts are really publicmanias, like the Tulip mania, and occur only in the particular sectors of the economy where the mania has taken hold whereas the artificial booms and busts created by interest-rate manipulation by the central bank result in economy-wide booms and busts.
The dot-com and housing bubbles are a new trend in the history of fiat money where government and the central bank are working hand-in-hand to guide inflationary cash into particular sectors, making the artificial booms and busts look more like natural manias. Of course, this is a thin veneer over the truth - the entire financial system has been suspended in a highly unstable state for going on four years now. Despite the feverish efforts of the mainstream to blame the man on the street for being too house-buying-obsessed, the housing mania could not have caused the economy-wide problems we are seeing today without the attendant manipulation of interest rates which do affect the entire economy.
I have no explanation for the changes in the log-rate of growth of the money supply but what you see as a “permanent change” in the rate of money growth I see as more of a plateau during the 90’s with a resumption of the older growth rate, or slightly higher, since 2000. But, then, I’m not sure we can just blindly use the data like this so I think more care is needed to explain why I should believe that the log-rate of growth of the money supply is a meaningful number that reflects something about the policies of the Fed.
The bubbles will get ever larger as each bubble gets “saved” by the next, because the busts have never been allowed to eradicate the malinvestments completely. This increasingly volatile see-saw will last until the BIG bust (the dollar collapse) picks up ALL the cans that have been kicked down the road over the decades.
ABCT explains cummulative, not contemporaneous, phenomena. There is a definite time lag between causes and effects.
There seems to be a problem with the scaling of that graph. The natural log of 7.5 trillion is around 29, but the natural log of 283 billion is about 26, not 14. Using the raw data, the growth of TMS was actually 4.9% anually up to 1981, and 7.6% annually from 1981 to present
And clayton, that is like putting your head under the sand. if the theory doesnt quantitively match reality, it is a bad theory. even your hero rothbard admitted that, so this is a serious critique of ABCT, by murray’s own premises
and z1235, that story is like sciff’s armageddon predictions. he was talking about dollar collapse in 2003 and he keeps postponing it. it was supposed to come during 2nd QE, then it didnt. THen was supposed to after gold surges, but it didnt. There simply isnt enough lending for the inflation to pick up.
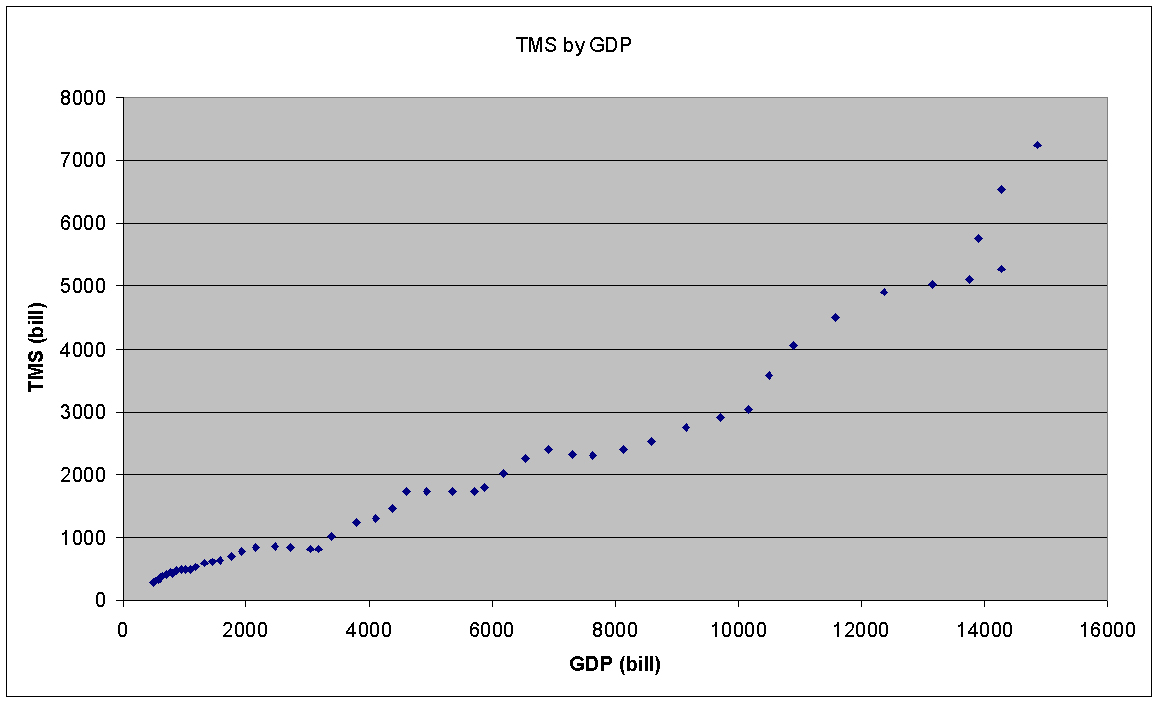
Looking at TMS by itself is pointless. Why? Because we have no basis for comparison to anything else. So let’s compare it to GDP (numbers from http://research.eco5.com/):
Get out your scientific calculator and check it out. The logarithmic chart covers a vertical range of 14-29 powers of e, which is $3.3 million - $3.9 trillion. Does it make sense that the money supply was $3.3 million in 1959 and expanded by 1.2 million times since then? No, the log chart is in error.
The text on the main page that you linked explains how and why TMS differs from the feds ‘M’ series’. If you think its wrong to calculate it this way, maybe you can explain why, but if it’s wrong then it’s irrelevant whether or not it contradicts ABCT. Personally, I think it’s more accurate since it captures the flattening of growth that must have occurred with the high interest rates of the late 70’s / early 80’s as well as the surge in loans that should have occurred with the lowering of those rates.
Huey, its the TMS. TMS underestimates inflation pre reagan, and overestimates it reagan and post reagan. Seriously. Compare it to M2. M2 fits my conclusions. The FED data is what the professionals use, its been long established to be reliable and useful for the job, thats why it is used. TMS on the other hand is more of an esoteric metric, a maverick that has not yet caught on and is less relevant for macroeconomic analysis
You’ve fallen of a cliff. As you’re “flying” down, you and your Keynesian “experts” say: “Look, it’s a bit breezy but we’re OK.”. ABCT says: “You’ve fallen of a cliff and you’re about to splatter your brains out.” The fact that you haven’t hit the ground yet, is not “proof” that you will never hit it.
The Fed has made its exit strategy clear. It’s adopted an interest rate corridor system so that it can raise the fed funds rate in the event that inflation rears its head without crashing every asset market by suddenly dumping its whole balance sheet. It’s been very clear that the size of its current balance sheet (ie, the size of the money base) will not be permanent. As shown in Sumner (1993), an increase in the money supply that is expected to be temporary will not be inflationary. This is consistent with the spread on TIPS, which shows an expected rate of inflation of about 2% per year for the next ten years.
Also, it’s childish to put “experts” in quotation marks. Besides, I very much doubt you even understand the theory you’re criticising, let alone actually have reasonable criticisms of it that aren’t strawmen.
Not really sure what the point is on the first one…
How is it an ad hominem if the person never made an argument? I’d like an argument that’s not an appeal to mockery please. I believe that’s also a logical fallacy…?
Can we try again without arguments from authority? We already know that what works for the fed probably won’t work for an austrian. So why do you think that M2 better describes the money supply? It’s not just because it fits your conclusions, is it?
It was not a mockery. I was merely exposing the fallacy of the argument that the theory of gravity (ABCT) may be invalidated by the fact that a splat (collapse) has not yet occurred.
Not really sure what the point is on the first one…
Proverbs 14:15: “A gullible man will believe anything.” The point of the first one is that you believe everything the govt tells you. The Fed has made clear bla bla , the TIPs people estimate inflation etc.
Just one point out of many. The Fed bought toxic assets, meaning stuff nobody in his right mind will pay a dime for. The Fed paid full price. But don’t worry, they tell us. When the time comes, we will sell them. To whom? At what price? How can you believe that?
How is it an ad hominem if the person never made an argument?