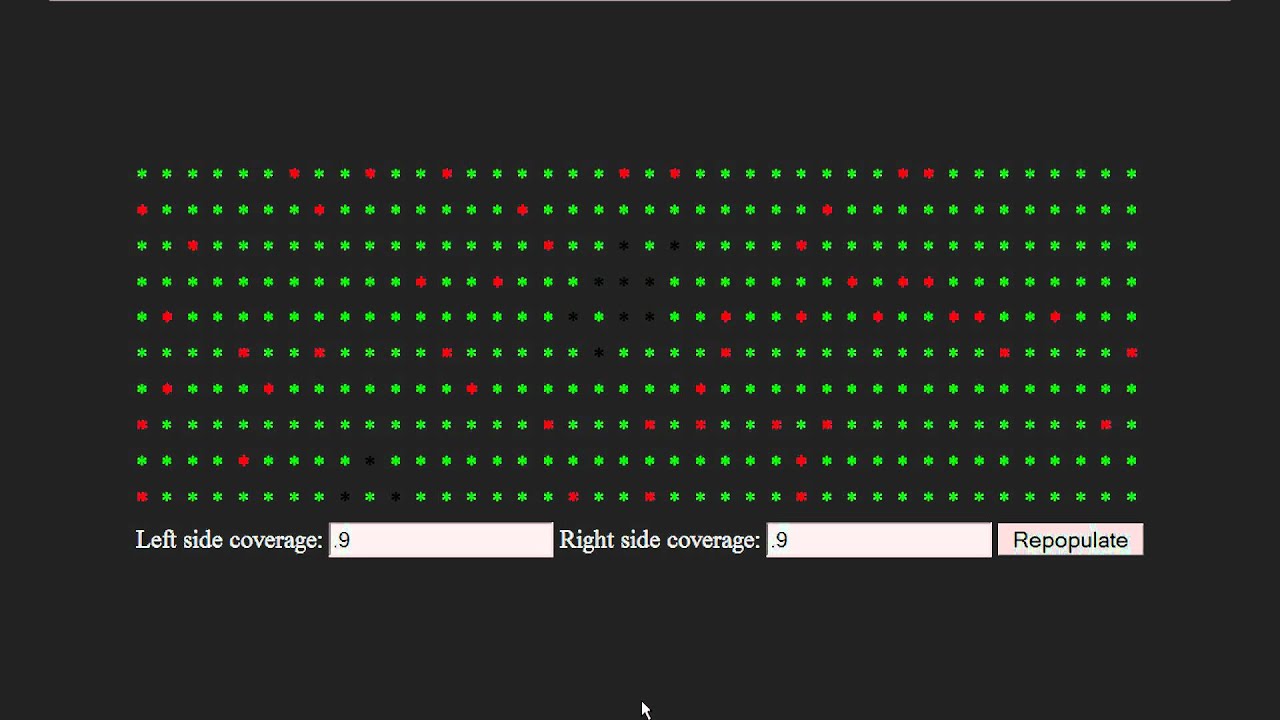
“so vaccines couldn’t do much anyway” Then how do you explain this? I just threw it together so the legend is incomplete but the red line marks the introduction of the vaccine.
MisguidedOpinions, that is a much better graph than the previously posted. It shows a much nearer correlation of vaccine deployment and fall in polio cases. Critics who will point out that cases were falling before deployment should consider that polio cases also plummeted before deployment for no apparent reason. Though it is obvious that cases dropped massively and stood low since deployment. I am not aware of any other drastic changes between 1953 and 1963 that would cause such a fall.
Zangelbert Bingledack, the germ theory of disease merely states that germs cause diseases, that is there are no symptoms without the infection with germs. This does not rule out that other conditions have to be met too. The sole practical implication of this is to keep the body away from germs and if not practical or possible provide the body means to prevent the outbreak of the disease, i.e. vaccines.
re: the big graph, correlation is not causation, and even if it were we should expect the slope of the downtrend to increase when the vaccine was disseminated, but it doesn’t.
re: Metus, i agree, that is why i said bright-line germ theory, where i explained initially that i am talking about germs being the only cause, as if something just struck down from the heavens. a lot of people still believe this.
Zangelbert Bingledack, no one who performs medical research believes in bright-line germ theory. Immunologic theory is much more intricate nowadays. And intuitively many people know that the bright-line germ theory is wrong. Most people know that bad nutrition, lack of movement, drugs lead to bad health and ultimately higher infection rates. I do not respond to discredit you, I post merely because people can and will misunderstand such statements as yours and wave modern medical research off.
As to your comment on the graph, no we do not have to expect the slope to increase. We would, without vaccine, expect polio infections to rise, but they did not. Now, correlation does not imply causation but together with a plausibly theory of how vaccines and the immune system work we can not dismiss the statement “Vaccination against polio works” but we have stark evidence against “Vaccination against polio does not work”.
agree about not being able to dismiss vaccines based on the graph, but also not being able to draw conclusions in favor of them.
as to modern medical science not embracing bright-line germ theory, that may be so, but doctors prescribe and advise as if they did embrace it: except in obvious cases they only give minimal advice, if any, about nutrition, excercise, and so on. they tend to hair-trigger prescribe drugs. a major side effect of both chemotherapy and radiation is increased cancer rates (elsewhere in the body). although bright-line germ theory may be cognitively rejected, its legacy remains dominant.
i have to admit, though, that you could argue that this is more due to corporatism with big pharma influencing doctors than to any vestiges of black-and-white germ theory. but i suspect it’s a hearty helping of both.
“but it doesn’t” Actually it does increase. Take a close look at the original PDF file under magnification. Secondly, the graph showed that polio rates didn’t go down and stay down until vaccines were introduced.
Zangelbert Bingledack,
The graph shows what we would expect from vaccine deployment: A massive fall in cases.
Doctors are paid by insurances which in turn are controlled by the state. The argumentation could end here but I will waste a few words on this. In Germany a physician gets big money for prescribing some drug but only a few bucks for prescribing sport or better nutrition. And sadly most people do not really want to do something about their lifes and visit the physician solely to get a pill and feel happy about it. I think people, expecially physicians, know that good nutrition and sports solves most health problems but people want the easy way out.
As to chemotherapy, I do not see how that has any meaning. A treatment that worsens a patients state is legitimate if doing otherwise worsens the state even more. But this has nothing to do with germs since cancer, except for a few types, is supposedly not caused by germs. I will not discuss the themes in this paragraph further.
i agree that people also just want a pill. that is another part of it.
re: cancer is not germs…germs, pathogens, whatever—same concept, same approach. i think chemo is way overprescribed, although i am not prepared defend that claim. more like, if you think that as well, you may find my previous comments interesting.
MisguidedOpinions, the graph is quite inconclusive either way. nevertheless, the most obvious thing that sticks out is that polio peaked and fell more than it ever had fallen before PRIOR TO the introduction of the vaccine. this is hardly conclusive support for the vaccine.
i do not know enough about the actual polio vaccine to argue further; my only point is that that is not particularly solid statistical support for either conclusion.
Do you have any data for polio cases prior to 1937? Otherwise, all I see is a big spike after World War II, then the vaccine, then reported cases go back down. Based on the graph, I have no idea whether the relatively low number of cases in the 1937-1943 period is an aberration, or whether the 1944-1956 spike is one.
Umm… no.
The data is from here. I can’t find numbers going back before 1937, though I invite you to try.
One thing no one has pointed out, Sieben’s graph does not list any numbers to the veertical axis under death rate. If you zoomed in far enough, the fluctuations would look astounding, but zoom out far enough, and the death rates could be utterly negligible.
This is an interesting article (I don’t know if one needs an academic subscription to see it; if that’s the case, I can put up the pdf file somewhere): http://jama.ama-assn.org/content/281/1/61.full
Some figures:
This figure has polio data, but they are difficult to see:
The author states in the text about polio:
[P]olio mortality fell only marginally during the first 4 decades and then increased until the first polio vaccine was licensed in 1955. Polio mortality showed much year-to-year variability as well as a spike in 1916, corresponding to a major epidemic that started in New York City and swept through the northeastern United States during the summer of that year.14
The reference quoted [14] is: Rogers N. Dirt and Disease: Polio Before FDR. Piscataway, NJ: Rutgers University Press; 1992.
It’s available ton Google Books online here in a limited preview, but I couldn’t find the graphs that would zoom in on the incidence. I don’t have time now (until the end of the weekend) to read the text in detail or look for hard copy (or full electronic copy) or other sources; maybe others can do it. In general, Google Scholar search is better for such things than general Google search.
There is also qualitative information about the history of polio on one of Wikipedia’s articles.
All these graphs are at best correlatory. Another way to look at the role of vaccines is to look at what happens when people stop vaccinating (without change in hygenic conditions, food, etc.). From what I remember, there are cases in Africa (and US) where this happened. Stopping vaccination leads to increase in disease incidence. But I didn’t look at the data in detail (this is from a Wikipedia article on vaccines; unfortunately, I don’t have time to locate it right now).
It is also important to differentiate between incidence rate and death rate. Many of the diseases one is vaccinated against can be non-deadly (or less frequently deadly) under improved conditions of hygiene, food, etc.
So, for instance, this anti-vaccine graph shows death rate:
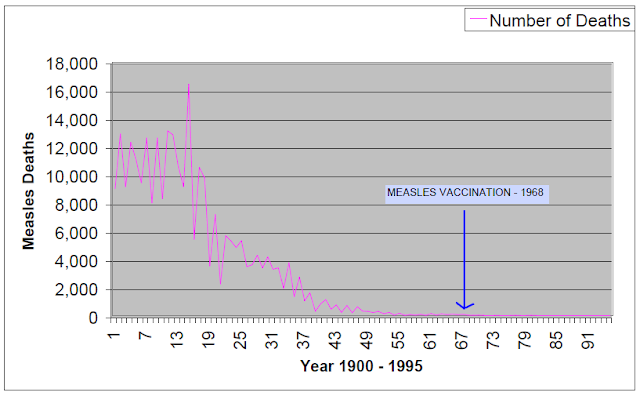
But this graph shows incidence rate:
Well, since you already bumped it…